Evaluate Learning Processes
Make Learning in the LMS Visible
Once the criteria have been appropriately defined and all students' data are entered in the LMSA Kit, the evaluation of individual learning processes can begin. There are several ways to analyze the performance of students. In addition to classical statistical methods, self-learning algorithms can also be used for learn progress evaluations and instrument calibration.
However, the canon of evaluation and analysis procedures is not complete. It is constantly being developed and supplemented. Corresponding comments and requests can be sent to the developers. Independent further developments are also possible. The open plug-in system allows each programmer to develop and implement their own extensions.
Results of analyzes are always generated in report form within the LMSA Kit. These reports are added as a new tab after the main tabs. When such a report is open, the adaptive main menu at the top of the menu bar displays a "Report" menu item. Depending on the report type, this menu shows different options. Among other things, the report can be closed to reduce the number of open tabs.
Classical Statistical Evaluations
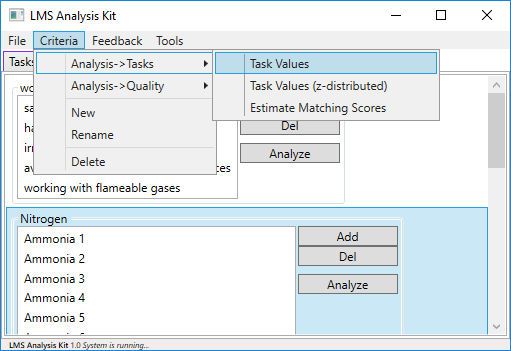
All analysis methods for the evaluation of individual learning processes are summarized in the main menu under the same heading. If the tab Criteria is visible, the adaptive main menu shows the menu item Criteria. All analysis tools that can be used to evaluate the individual learning processes in the LMS are behind the first entry. The second entry, on the other hand, contains all the analysis tools that can be used to check and improve the composition of the tasks for a criterion (for more information, see Criteria/Quality).
Individual Performance in Tasks
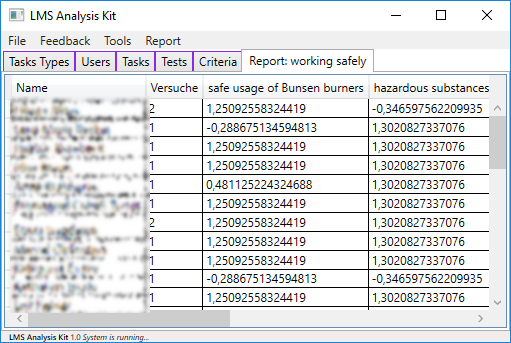
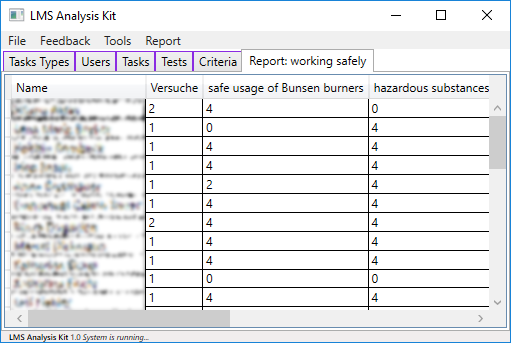
One of the simpler statistical evaluations is a comparison of the shown performances of different learners in the individual tasks of a criterion. This analysis function is available in two version. The first one creates a report that shows the score of each task for each learner in the record.
In the second version, the data in the report is additionally studentized, which means that the data is transformed to belong to a z-distribution. For this purpose, the respective task average is subtracted from the achieved score and divided by the standard deviation. In this way, the tasks can be compared more easily. A learner with a value of 0, vividly speaking, shows an average performance within this task, while a learner with a value of -1 does a standard deviation worse than the average in this task.

The simple statistical analysis methods give teachers a quick, clear overview of the learning processes regarding to a criterion. In particular, the performance of the individual learners within the criterion can be considered more closely. The individual needs of a learner can be determined more accurately. It is very obvious which tasks are solved well and where there are still difficulties.
Self-Learning Algorithms
The insight into the learning processes, which the simple statistical evaluations offer, can be insufficient in many places:
- In a large learning group, students with special needs can not be specifically identified in such a large table.
- The tasks of a criterion are often located at different times of the electronically supported class, so that learning processes are already documented in this data. This learning process is not obvious in a simple statistical analysis, it may even distort it. Difficulties normally occur at the beginning of a learning process, but should not be present at the end of a session.
- Tasks are not identical. Although all tasks within a criterion belong together, they do not all measure the same. Tasks have different requirement levels, which must be taken into account.
In order to meet the specificities of different tasks and learners, various concepts have been developed. One of the best known is the Rasch model. However, these models cannot be applied to the unstructured data from a LMS.
The LMSA Kit bypasses this problem by using matchmaking algorithms. These algorithms are actually used to assess the ability of a player to assemble opponents in duels who are as equal as possible. These algorithms learn with each new result and thus become more accurate. They can be also used for pedagogical diagnostics, as learners carry out "duels" against the individual tasks. In this way, difficulty values can be determined for the tasks and the ability values can be determined for learners. The formal requirements for the data are significantly lower than for Rasch models.
Matchmaking Algorithms
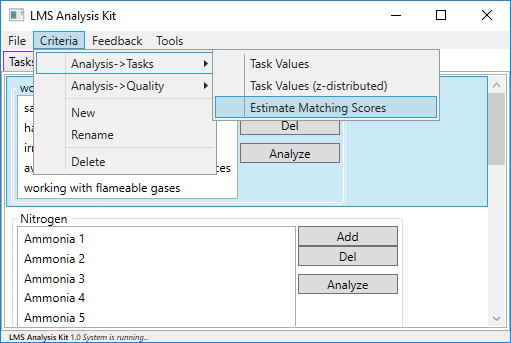
Once the desired criterion has been selected, the Estimate Matching Scores function is selected at the top of the menu bar. A new dialog box opens in which the individual algorithms can be selected for further analysis and can be configured as needed. Various preconfigured algorithms that have proven themselves during the evaluation of the software with this configuration can be easily created via the quick-insert bar at the top of the window. In the area below, the parameters of the algorithms can be modified. A click on Calculate! starts the evaluation. The result will be presented as a new report.
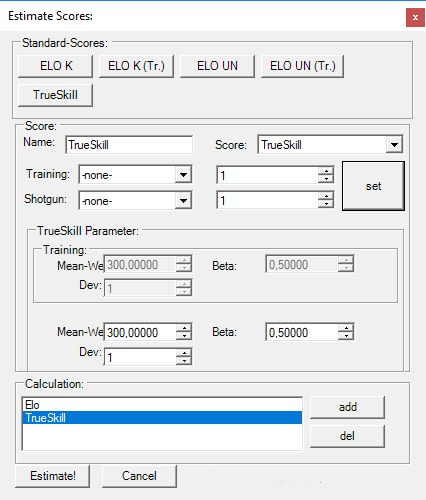
The individual algorithms and their exact configuration can not be discussed in detail here. A more detailed explanation of this can be found in the sub-heading Matchmaking Algorithms.
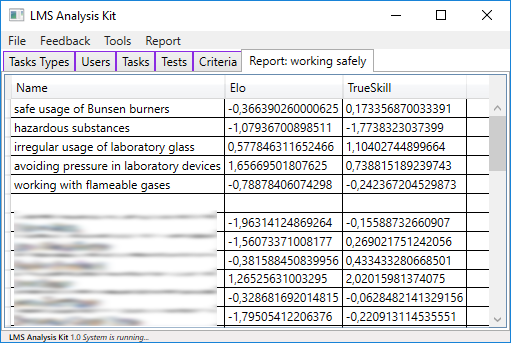
At the top of the report the difficulty values of the individual tasks of the criterion are presented. Below the empty line the ability values of the individual learners are shown. This data can also be used in the LMSA Kit to automatically generate feedback, so that learners can also participate in the information provided by the LMSA Kit.